We are following up on our previous post (“We are all in this together“) to give an update on how Q1 ended with a deep dive into both the supply and demand sides. We are just a few days into April, so it’s a bit early to tell exactly how the month will end up. We are unaffectionately dubbing it “the second January”, but we are hopeful the quarter will be picking up as advertisers continue to adjust their messaging.
The Shining Light on the CPM Index
To kick things off, we want to highlight our CPM Index. You can find the index within our dashboard, and below you’ll see a quick gif (do you pronounce it “jif” or a hard G like “gift”?).
The index is a quick snapshot of how specific publisher verticals are doing at Freestar. It’s a good way for you to see how you are doing in your competitive set, or just to get a sense for how other publishers are doing.
Q1 2020 Supply or: How I Learned to Stop Socializing and Love Coughing into my Elbow
We have been hearing from a lot of our clients asking us to share more granular network-wide data, so we want to start with how the first quarter looked from the supply/publisher perspective. These are unprecedented times (something I find myself saying a dozen times weekly), so we want to provide you with some additional information to help understand how the landscape is looking, and make it clear that you are not alone in this struggle.
For the analysis below, we took a look at our top 100 websites, and then dove a bit deeper on a cohort of 40 of those websites that had either a 15%+ increase or decrease in CPMs going from February to March. The data in this section is based on filled impressions and revenue from our aggregated demand partner data.
Comparing January to February:
- 11 of the 100 total sites had a decrease in CPMs
- 4 sites had a 15%+ decrease in CPMs
- 2 are in the Gaming vertical
- 4 sites had a 15%+ decrease in CPMs
- 88 of the 100 total sites (1 site was not live in January) had an increase in CPMs
- 48 sites had a 15%+ increase in CPMs
- 15 are in the Entertainment vertical
- 4 are in the Sports vertical
- 3 are from each of the Utility, Health, Education, and eCommerce verticals
- 48 sites had a 15%+ increase in CPMs
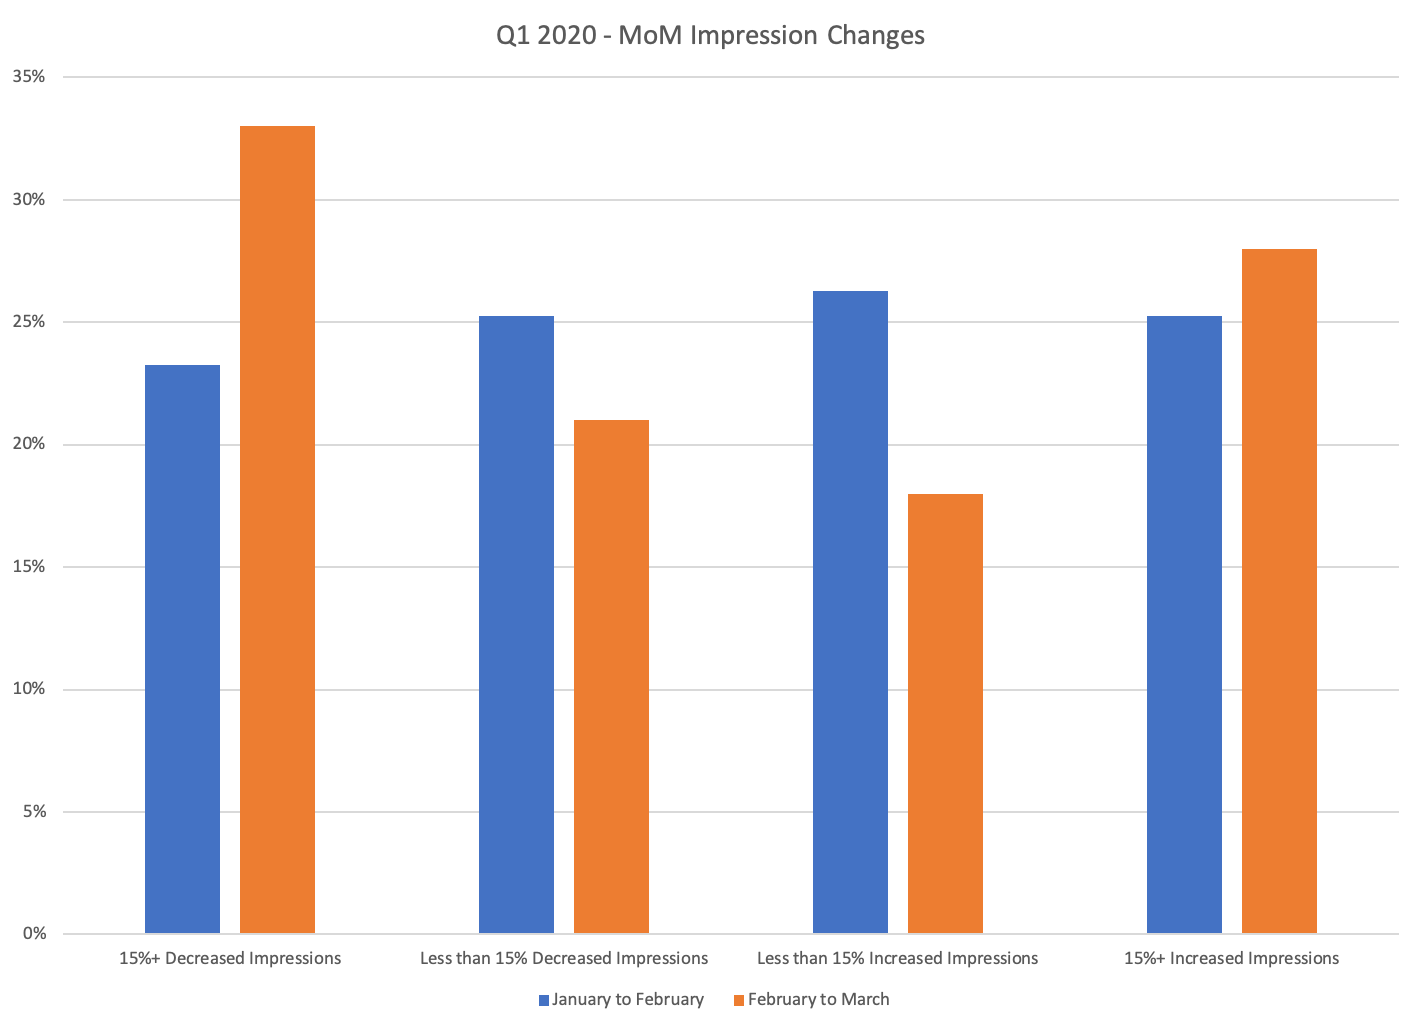
- 48 of the 100 total sites had a decrease in daily average impressions
- 23 sites had a 15%+ decrease in daily average impressions
- 6 are in the Entertainment vertical
- 5 are in the Sports vertical
- 3 are from each of the Finance, and Health verticals
- 23 sites had a 15%+ decrease in daily average impressions
- 51 of the 100 total sites had an increase in daily average impressions
- 25 sites had a 15%+ increase in daily average impressions
- 8 are in the Entertainment vertical
- 3 are from each of the Gaming, and Education verticals
- 25 sites had a 15%+ increase in daily average impressions
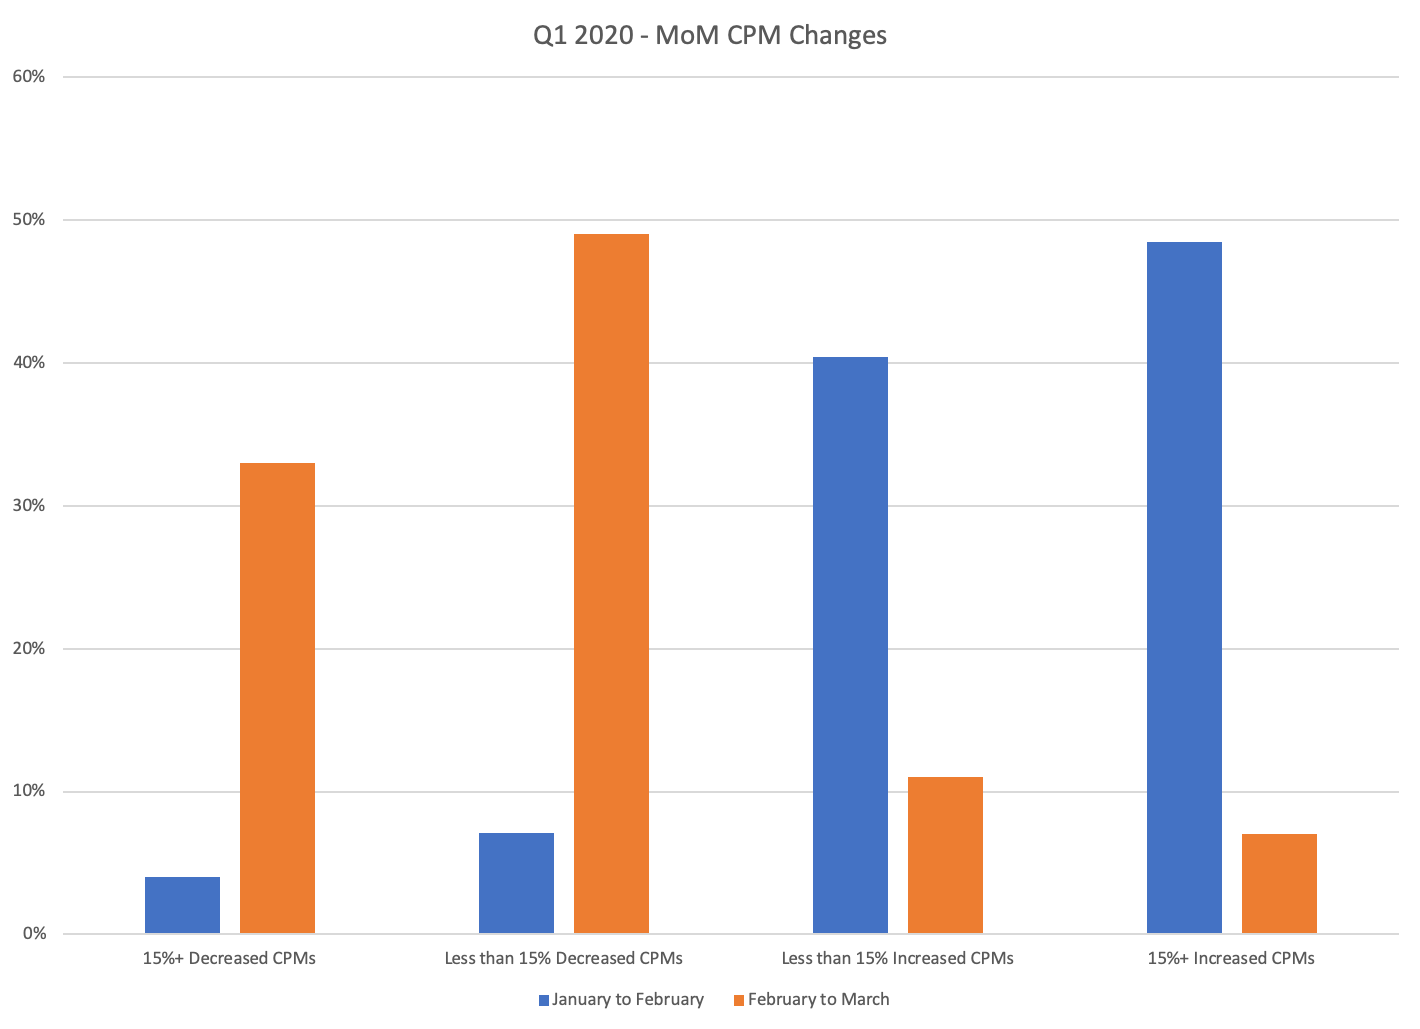
Comparing February to March:
- 82 of the 100 total sites had a decrease in CPMs
- 33 sites had a 15%+ decrease in CPMs
- 10 are in the Entertainment vertical
- 8 are in the Sports vertical
- 3 are from each of the Education, Finance, and Gaming verticals
- 33 sites had a 15%+ decrease in CPMs
- 18 of the 100 total sites had an increase in CPMs
- 7 sites had a 15%+ increase in CPMs
- 2 are in the Education vertical
- 7 sites had a 15%+ increase in CPMs
- 54 of the 100 total sites had a decrease in daily average impressions
- 33 sites had a 15%+ decrease in daily average impressions
- 7 are in the Entertainment vertical
- 5 are in the Sports vertical
- 4 are from each of the eCommerce, and Hobby verticals
- 33 sites had a 15%+ decrease in daily average impressions
- 46 of the 100 total sites had an increase in daily average impressions
- 28 sites had a 15%+ increase in daily average impressions
- 10 are in the Entertainment vertical
- 4 are in the Finance vertical
- 3 are in the Sports vertical
- 28 sites had a 15%+ increase in daily average impressions
Of the 40 sites, with a 15%+ decrease/increase in CPMs comparing February to March:
- 21 sites had a decrease in daily average impressions January to February
- 11 of which are a 15%+ decrease in daily average impressions
- 18 sites (1 site was not live in January) had an increase in daily average impressions January to February
- 11 of which are a 15%+ increase in daily average impressions
- 15 sites had a decrease in daily average impressions February to March
- 10 of which are a 15%+ decrease in daily average impressions
- 25 sites had an increase in daily average impressions February to March
- 19 of which are a 15%+ increase in daily average impressions
2020: A Demand Odyssey
You can always see how demand partners are performing on your site by building out a report in our dashboard.
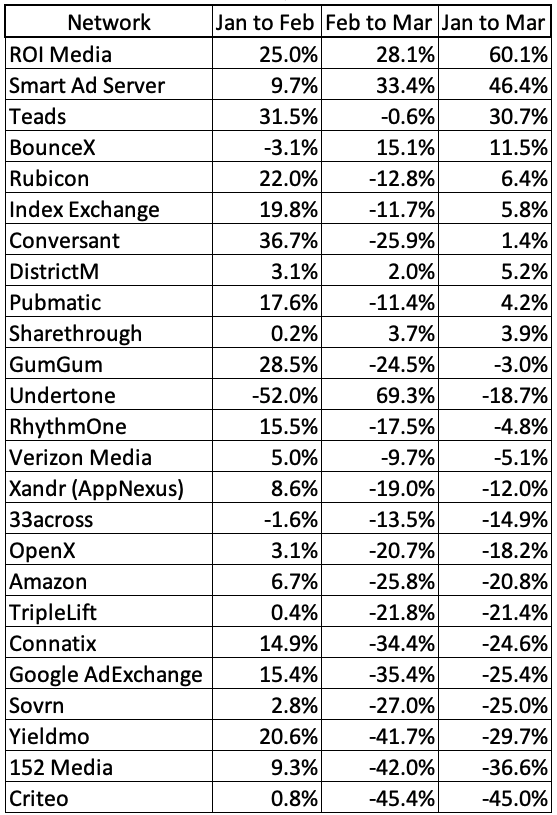
Below is an aggregated view of how CPMs change by network by month. If this were any other year, this data would look incredibly confusing. The typical expectation is that CPMs rise each month of each quarter, but of course we are in unprecedented times (that’s two for this article). I’d say the actual outliers here are the networks that were able to keep CPMs positive MoM regardless of what was happening in the world. Sharethrough, DistrictM, ROI Media, and Smart Ad Server all stayed positive for each of these CPM comparisons
Here are our top 25 demand partners, comparing CPM for the quarter:
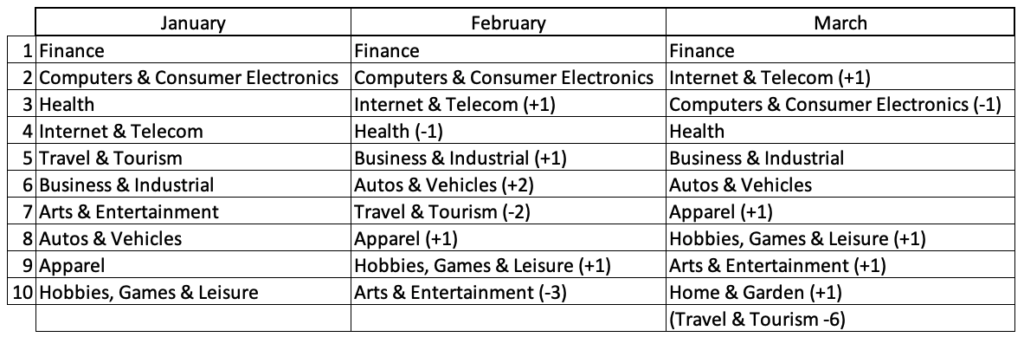
As Google Ad Exchange (AdX) is typically a top buyer for most publishers, we want to take a deeper dive into their advertiser verticals to see how those trends shook out. Surprisingly to me, the auto vertical stayed relatively strong via AdX given the nature of the world; unsurprisingly, Travel buying took an incredibly hard hit moving from 5th to 7th to 13th.
Here’s the top 10 AdX advertiser verticals by spend by month in Q1 2020:
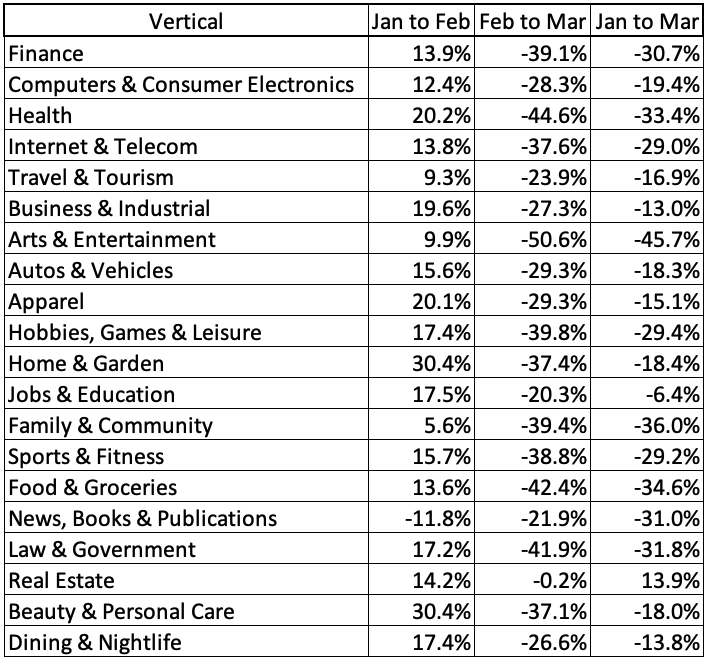
Next up, we want to look at the top 20 AdX advertiser verticals, and how their CPMs have shifted MoM. The verticals are stack-ranked by most spend in the quarter. Again, we see expected CPM growth from January to February, and then the COVID-19 impact in March.
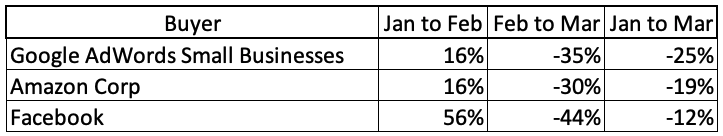
The last look we took was into the top AdX buyers. The “holy trinity” here of Google, Amazon, and Facebook all dropped their CPMs by 30%+ in March (compared to February), which is where the majority of the CPM softness came from with AdX.
We are keeping a close eye on performance in April. Where possible, we are making changes to ad stacks to adapt to the changes in the market, and keeping in close contact with our demand partners. Our programmatic demand team and our CEO, Kurt Donnell, are having regular conversations with upper management at our top demand partners. In addition to the ad stack, our yield managers are regularly working on experiments and sharing findings, and we are exploring ways to further expand our ad product offering.
We can’t control the weather, but we are your umbrella. Sorry, I had to end with something cheesy.